
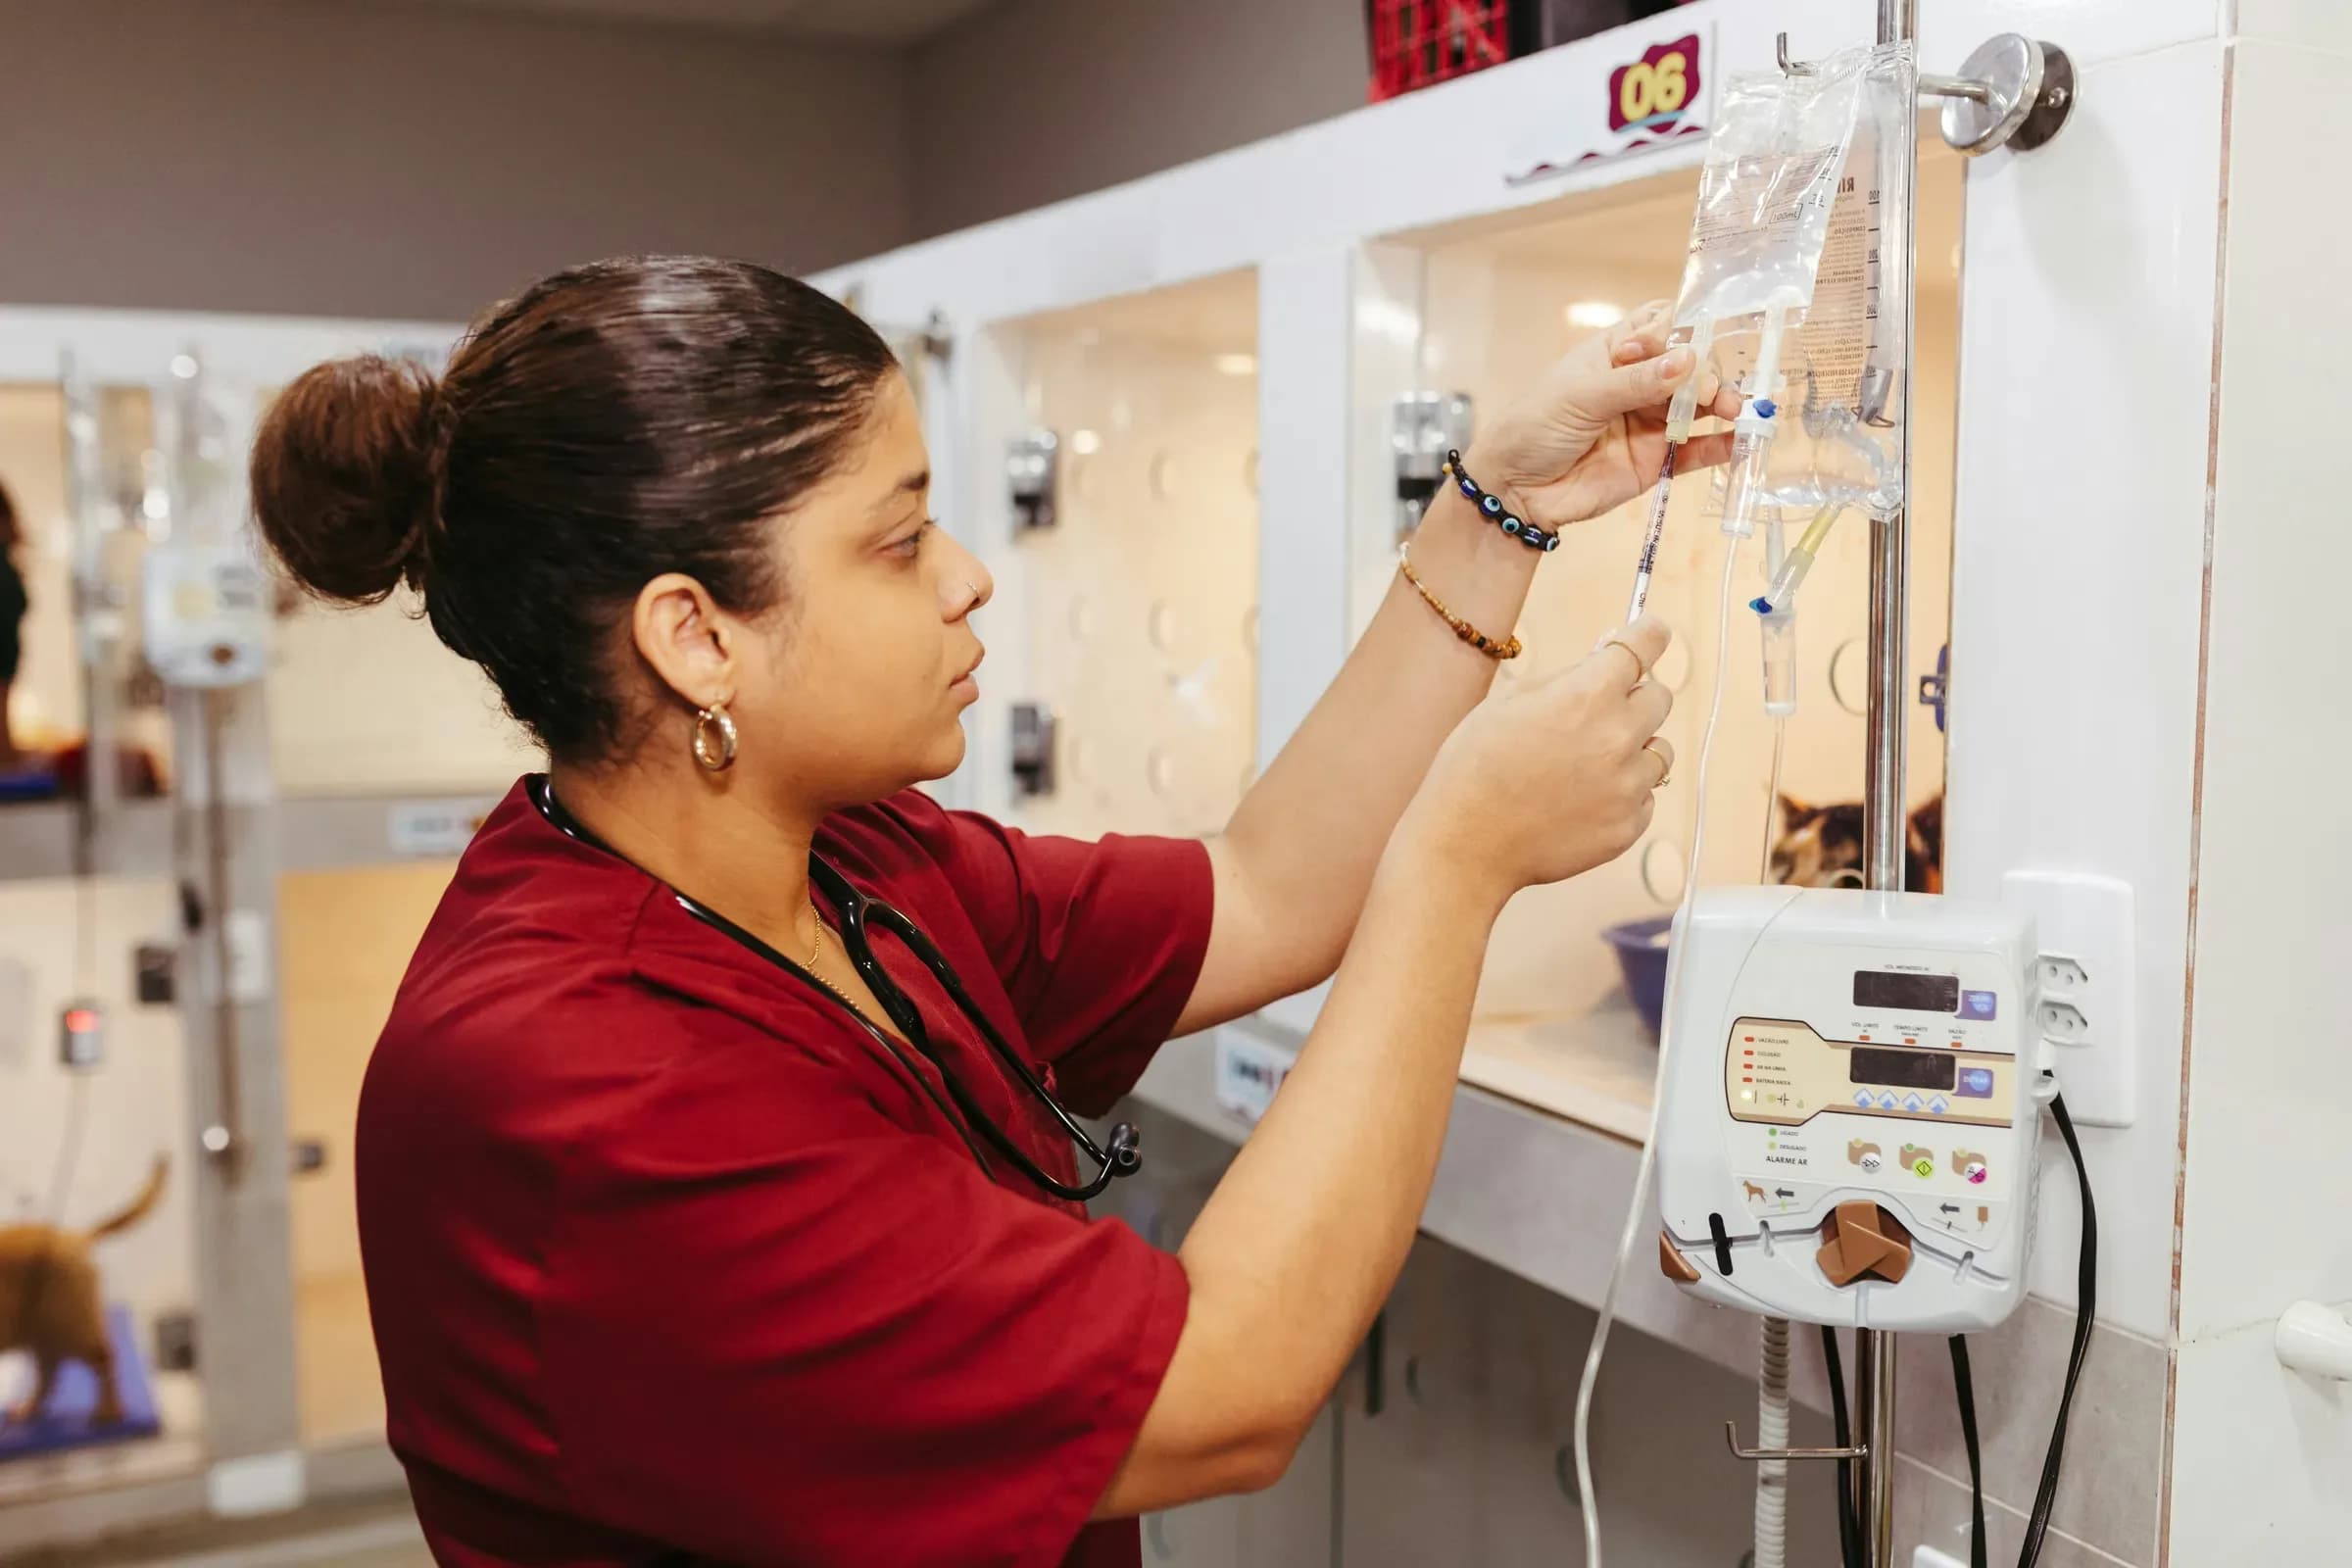

If you have been to a practice management talk in the last fifteen years, you have probably heard it. Each additional credentialed veterinary technician per veterinarian adds $93,311 in gross revenue. It turns up in conference slides, consultant decks and trade articles, usually as settled fact.
I went back to the original paper. The number is real, but it comes from 2007, it describes a correlation rather than a cause, and it has been doing a lot of work it was never designed for. The better news for practice owners is that the case for using technicians properly does not need it. The newer evidence is about retention, and it is more urgent.
Where the number comes from
The $93,311 figure comes from a one-page JAVMA analysis of the 2008 AVMA Biennial Economic Survey, describing practice revenue in 2007.
J. Fanning and A. J. Shepherd ran an ordinary least squares regression on 328 veterinarians who fully answered the questions on gross revenue and staffing ("Contribution of veterinary technicians to veterinary business revenue, 2007," JAVMA 236(8), 15 April 2010). Their model found that each one-unit increase in the ratio of credentialed technicians to veterinarians was associated with $161,493 more gross practice revenue (P = 0.021). Dividing by the average of 1.73 veterinarians per practice gives the famous $93,311 per veterinarian.
Three details rarely travel with the number.
It is 2007 money. The figure has never been updated in the form people quote it, and it predates the pandemic boom, the staffing shortage and four years of falling visits.
It is an association. A regression on survey data cannot tell you that hiring a technician causes the revenue. Busier, better-run practices may simply hire more credentialed staff. The authors offered a sensible explanation, that skilled technicians free veterinarians for work only a veterinarian can do, but the analysis itself does not establish it.
The comparison everyone repeats is not in the data either. The same model put noncredentialed technicians at $10,567 per unit of ratio, with a P value of 0.338. That is not statistically significant. The popular version, credentialed staff worth ninety thousand dollars and noncredentialed staff worth a few thousand, overstates what the study could show about the second group.
| What the study found | Figure | Caution |
|---|---|---|
| Practice revenue per unit increase in credentialed technicians per veterinarian | $161,493 (P = 0.021) | 2007 revenue, association only |
| Same, per veterinarian (divided by 1.73 vets per practice) | $93,311 | The figure usually quoted |
| Practice revenue per unit increase in noncredentialed technicians per veterinarian | $10,567 (P = 0.338) | Not statistically significant |
| Model fit (adjusted R²) | 0.60 | Other factors explain the rest |
| Respondents | 328 veterinarians | 2008 AVMA Biennial Economic Survey |
The finding may well be right. It is also old and modest in what it can prove, and a practice owner deciding on staffing in 2026 deserves better evidence than a regression on revenue from the year the first iPhone went on sale.
The evidence that matters now: technicians are leaving
The stronger case for full utilization is that underused technicians leave, and the profession cannot afford to lose them.
The largest recent study is a survey of 2,176 veterinary assistants, technicians, nurses and technician specialists conducted between September 2023 and January 2024 by Lori Kogan, Leslie Carter and Kelly Foltz, published in the Journal of Veterinary Emergency and Critical Care in October 2025 (PMC). Sixty-four percent of respondents reported decreased interest in remaining in the field long term.
When asked what was pushing them out, respondents rated these as having a significant negative impact:
When asked what was pushing them out, respondents rated these as having a significant negative impact:
Source: Kogan, Carter and Foltz, Journal of Veterinary Emergency and Critical Care, 2025 (n = 2,176).
The utilization findings sit right next to those. Only 14% of participants felt that at least 90% of their skills were used, and 28% said they spent more than half their time on tasks that need less training than they have. The barriers they named were workplace culture limiting tasks, veterinarians not trusting them with more, and veterinarians simply not knowing what they are trained to do.
NAVTA's 2024 demographic survey points the same way from a different sample (NAVTA). Only 36% of respondents felt fully utilized in their roles. Forty-eight percent saw little difference between the responsibilities of credentialed technicians and uncredentialed support staff. The share describing themselves as extremely satisfied with their job fell to 8% in 2024, from 25% in 2022, and 88% reported having experienced compassion fatigue at some point. Average gross income was $53,759.
NAVTA's 2024 demographic survey points the same way from a different sample (NAVTA). Only 36% of respondents felt fully utilized in their roles.
Source: NAVTA demographic surveys, reported 2024.
Read those two studies together and a pattern appears that is uncomfortable for owners. The things technicians say drive them out are mostly in the practice's control. Pay is partly constrained by the economics every practice faces. Leadership, staffing and whether a trained person is allowed to use their training are decisions made inside the practice.
What vet techs are paid, and why pay alone does not explain it
Pay was the factor most respondents rated as pushing them out, so it is worth knowing the actual numbers. The US Bureau of Labor Statistics put the median annual wage for veterinary technologists and technicians at $47,380 in May 2025, or $22.78 an hour. The lowest-paid tenth earned under $35,710 and the highest-paid tenth over $63,180 (BLS). NAVTA's 2024 survey, where 83% of respondents were credentialed, reported a higher average gross income of $53,759.
| Measure | Figure | Source |
|---|---|---|
| Median annual wage, all veterinary technologists and technicians | $47,380 (May 2025) | BLS |
| Median hourly wage | $22.78 | BLS |
| Lowest 10% / highest 10% | under $35,710 / over $63,180 | BLS |
| Average annual gross income, NAVTA respondents (83% credentialed) | $53,759 | NAVTA 2024 |
| Jobs in 2025 / projected growth 2025 to 2035 | 131,400 / 9% | BLS |
| Projected openings each year | about 13,400 | BLS |
The two sources measure different populations, so the gap between them is not a contradiction. BLS counts everyone in the occupation; NAVTA's respondents are mostly credentialed and self-selected. Either way, BLS projects about 13,400 openings a year, much of it from people leaving the occupation, which is the retention problem in one number.
Pay matters, and in a market where practice revenue per veterinarian has fallen in real terms, most owners cannot fix it with a raise alone. That is why the other factors deserve attention. In the Kogan study, satisfaction with respect at work, the ability to contribute to animal well-being, professional development and the ability to effect change all predicted burnout and fulfillment. None of those appear on a payslip.
Why it is also a revenue problem
Every technician who leaves takes their capacity with them, and capacity is exactly what practices are short of.
The AVMA's benchmarking data puts the average practice at a medical staff to veterinarian ratio of 2.21 to 1 in 2024, and the average veterinarian seeing about 15 patients a day, down from 16.6 in 2021 (AVMA, October 2025). Real revenue per veterinarian has fallen from nearly $600,000 in 2019 to $554,982 in 2024. When the veterinarian is doing work a technician is trained and licensed to do, the practice is paying its most expensive clinical hour for the wrong job, and the technician is being quietly told their training does not count.
That is where the old regression and the new surveys agree. Fanning and Shepherd's explanation for their result was that skilled technicians free veterinarians for veterinary work. Kogan and colleagues found technicians leaving partly because that freeing never happens. The same mechanism shows up once as a revenue opportunity and once as a retention failure.
A utilization audit you can run in a week
The fastest way to find out where you stand is to write down what happens during a normal week and compare it with your job descriptions.
The fastest way to find out where you stand is to write down what happens during a normal week and compare it with your job descriptions.
- Ask each veterinarian to log tasks for five working days. Keep it rough. Categories are enough: anesthesia induction and maintenance, dental cleaning and radiographs, client education, sample collection, discharge conversations, and so on.
- Check each category against what your jurisdiction allows a credentialed technician to perform. The AAHA's 2023 Technician Utilization Guidelines are a useful reference for what full utilization looks like in practice, and they exist precisely because many teams are unsure where the line sits.
- For every task a technician could legally do, write down why a veterinarian did it. The answers usually fall into three groups: habit, trust, or nobody else being free. The first two are fixable this month. The third is a staffing problem, and it deserves to be named as one rather than hidden as a utilization issue.
- Ask your technicians the same question from the other side. Which parts of their training have they not used in the last month? The Kogan study found veterinarians' lack of awareness of technicians' skill levels was one of the main barriers, which suggests many owners would be surprised by the answers.
- Re-run it a month later and see whether patients per veterinarian per day moved.
The part tools can help with
What technicians ask for is the chance to do the work they trained for, with enough support to feel confident doing it. In the areas where the stakes feel highest, clinical support tools can close some of the trust gap the Kogan study identified.
Anesthesia is the clearest example. The technician usually handles the moment-to-moment work of a procedure, and the veterinarian's reluctance to step away often comes down to wanting a second set of eyes on the numbers. That is the situation AI Anesthesia Assist was built for: at each vitals entry, it reads the reading against the patient's full history and returns an advisory stability or risk indication with a guideline-based comment for the team to weigh. It assists; it does not decide, and the veterinarian keeps clinical responsibility. What it can do is give a technician running the anesthesia and a veterinarian in the next room the same structured read of the same patient.
The number to replace the old one
If I could retire one figure from practice management talks, it would be $93,311. It may be true, and it still lets owners think of technician utilization as a revenue trick. The figure worth remembering now is 64%: the share of technicians, assistants and nurses who reported decreased interest in staying in the profession. Most of the reasons they gave, and most of the fixes, sit inside the practice.
References
- Fanning J, Shepherd AJ (2007). Contribution of veterinary technicians to veterinary business revenue, 2007. JAVMALink
- Kogan LR, Carter L, Foltz K (2025). Perceptions and Experiences of Veterinary Assistants, Veterinary Technicians/Nurses, and Veterinary Technician Specialists. Journal of Veterinary Emergency and Critical CareLink
- NAVTA, (2024). NAVTA's 2024 Demographic Survey Reveals Strong Feelings on Title Protection, Income, Role Clarity, and WellnessLink
- AVMA, (2025). Benchmarking data plus elevating efficiency equals practice productivity,Link
- (2025). US Bureau of Labor Statistics, Occupational Outlook Handbook, Veterinary Technologists and Technicians (May 2025 wage data):Link
- (2023). AAHA, 2023 Technician Utilization Guidelines:Link